Siemens: Performance Insight – Increase the Performance of Machines & Lines
November 3, 2026
Performance of Machines & Lines: The Productivity Losses Hiding in Plain Sight
Performance Insight on Industrial Edge turns production data into a shared view of machine and line performance, helping teams move from transparency to focused improvement.
By: Selma Maria Silvestre da Silva, Communications Manager & Anna Mueller, Marketing for Industrial Apps
It’s Monday morning. The production team is reviewing the previous week. The line delivered, the machines ran, and the numbers are on the screen. Yet one question keeps coming up: Where exactly did performance drift? The production manager points to the trend. “We were running all week. So where did we lose time?” Maintenance has a different perspective. “I know which machine was giving us trouble, but I don’t know how much line time we lost because of it.”
An operator recalls several minor interruptions during one shift. Each observation is useful; together, they tell a bigger story. That story already exists in the production data. The challenge lies in translating machine signals, states, and events into information that different teams can understand and use.
From Machine Signals to a Shared View
Industrial Edge provides this environment close to production. It brings computing and applications to the factory floor, where it collects and processes data from machines, controllers, sensors, and production lines. Connectors integrate data from newer and existing equipment. The Industrial Information Hub then standardizes and contextualizes that data for further use.
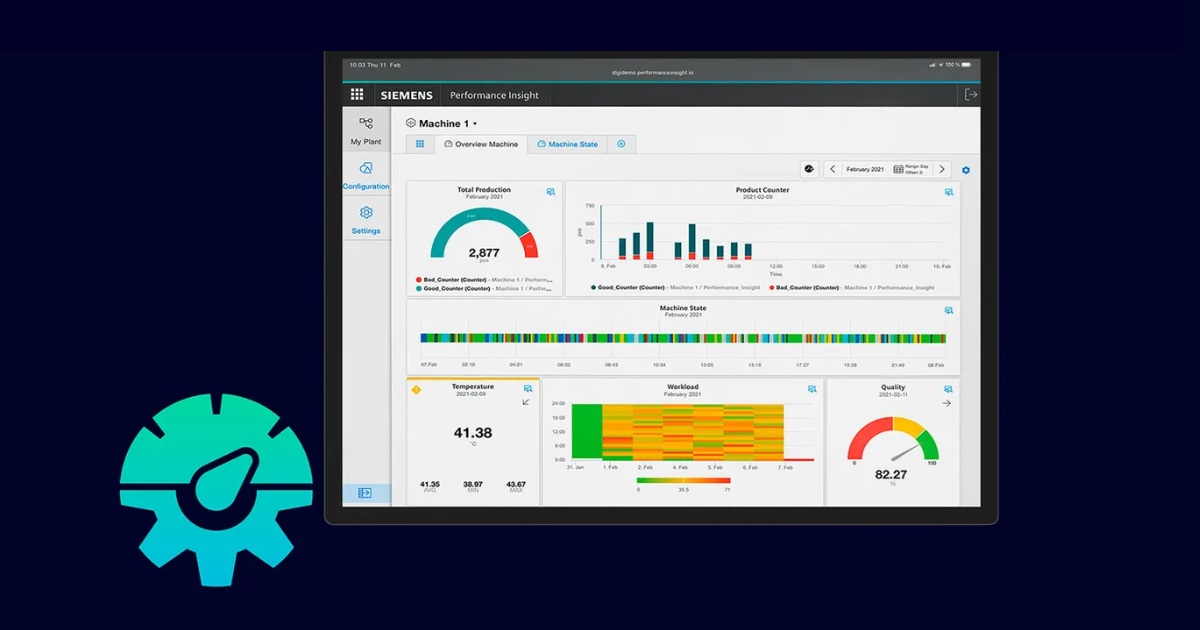
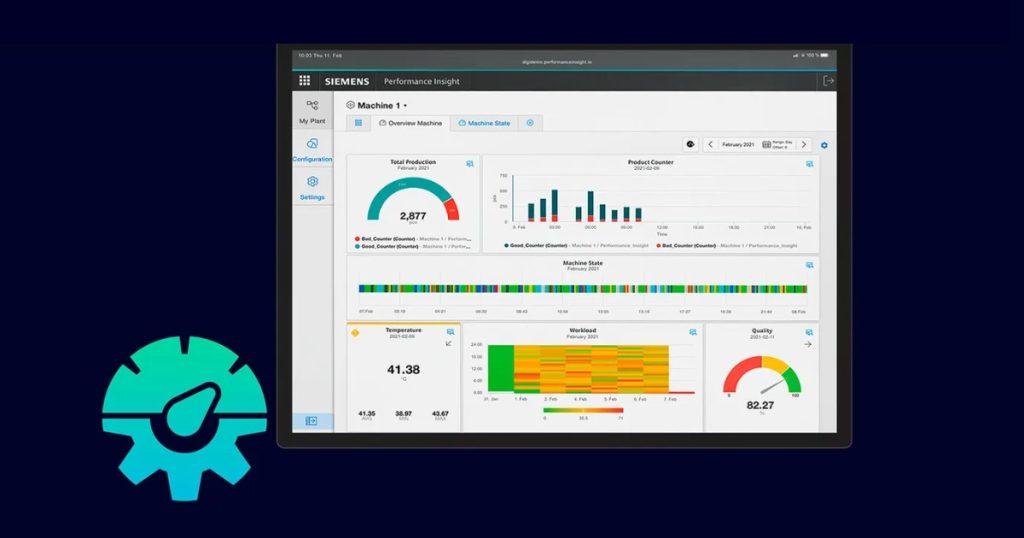
Performance Insight uses this foundation to calculate and visualize production KPIs. Dashboards cover individual assets and allow users to select observation periods and widgets that address specific questions. OEE provides a familiar starting point by combining availability, performance, and quality. Other KPIs include mean time between failures (MTBF) and mean time to repair (MTTR).
Recurring reports are generated automatically and distributed to selected recipients, keeping production, maintenance, and management aligned without rebuilding the same analysis each week. This changes the tone of the Monday morning meeting.
Follow the Question Through the Data
A KPI is valuable when it leads somewhere. When availability is lower than expected, teams can examine when and which asset was involved in the interruptions. Gantt charts and sub-asset analysis narrow the scope of the investigation. Error analysis reveals which recurring issues deserve closer attention.
Performance questions follow a similar path. Step Time Analysis highlights process steps that exceed defined duration limits. Users can then drill down further and compare the performance of individual steps over time or across different products.
The discussion becomes more precise. For example, an engineer might say, “We keep seeing the same delay here,” while looking at the analysis. This is a more specific starting point than the general impression that the line felt slower last week. The team can then focus its expertise where the data shows the clearest opportunity. Production managers want to understand line performance. Maintenance teams want to trace losses to assets and recurring causes.
Operators need information relating directly to the processes they run. Configurable dashboards present production data in a way that supports these different perspectives.
Start Where the Questions Are Clearest
Production analytics do not have to start with the entire plant. A single machine or production line can be a useful starting point, especially when the team knows the specific questions they want answered. Why does availability vary between shifts? Which recurring disturbances consume the most time? Where are process steps taking longer than expected?
Performance Insight provides ready-to-use analysis functions for these questions, as well as flexible dashboards and KPI calculations that teams can adapt to their production environment.
This approach is particularly practical for machine-intensive operations because existing equipment remains part of the picture. Industrial Edge connectors collect operating data from greenfield and brownfield systems, providing transparency regarding assets installed at different times and from different automation generations.
From One Insight to the Next
Once a team has a clear understanding of one machine, they can apply the same approach to others. They compare similar assets, view lines over equivalent periods, and examine performance patterns across a broader production environment.
This gradual expansion is important because value comes from applying insights to real operational questions. For example, a first dashboard may reveal where availability is being lost. A deeper analysis may identify a recurring cause. A comparison may show that the same pattern appears elsewhere. Each step creates a stronger basis for the next decision.
By the end of the Monday meeting, the team may still have work to do. The difference is that everyone will know where to start. The production manager understands the performance picture, maintenance knows where to investigate, and the operators can relate the findings to what happens on the machines.
The machines have been generating the clues all along. Performance Insight turns those clues into a clearer path from transparency to improvement.
Learn more about it: Performance Insight – Visualize productivity | Siemens
For more information on Siemens solutions HERE

Machines Machines Machines Machines